Luna Modeler – ER Diagrams for Any Database via ODBC/JDBC
- Any ODBC or JDBC driver Firebird, legacy systems and niche engines
- Logical data model Entities, keys and relationships on one diagram
- Documentation Interactive HTML reports, PDF and images
- Stays up to date Update the model when the database changes
The problem: no tool speaks your database
Not every important database is PostgreSQL or SQL Server. Many companies run a Firebird system that has worked for twenty years, an engine bundled with an ERP, or a database that only a few tools know about.
When you look for a data modeling tool, these databases are usually missing from the list. So the structure stays hidden inside the database, and the only way to see it is to write queries against the system catalog.
The pain point: knowledge that lives in a few heads
Without a diagram, nobody sees the whole picture. New developers need weeks to learn which table holds what. Analysts guess how the data connects. A migration project starts with days of reading table definitions one by one.
And when the colleague who knows the database leaves, that knowledge leaves with them.
How Luna Modeler helps: a clear logical data model
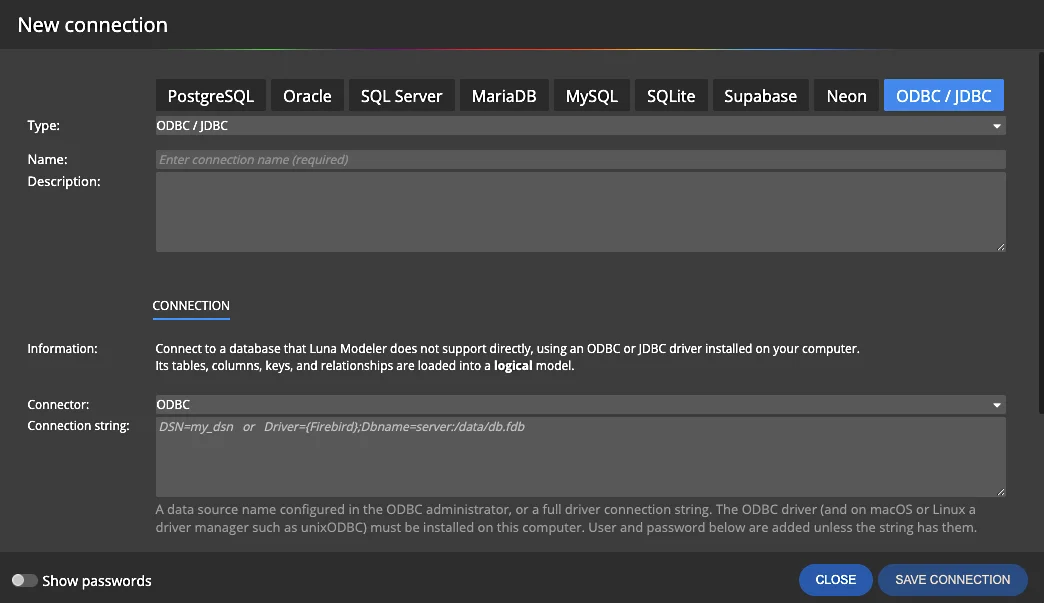
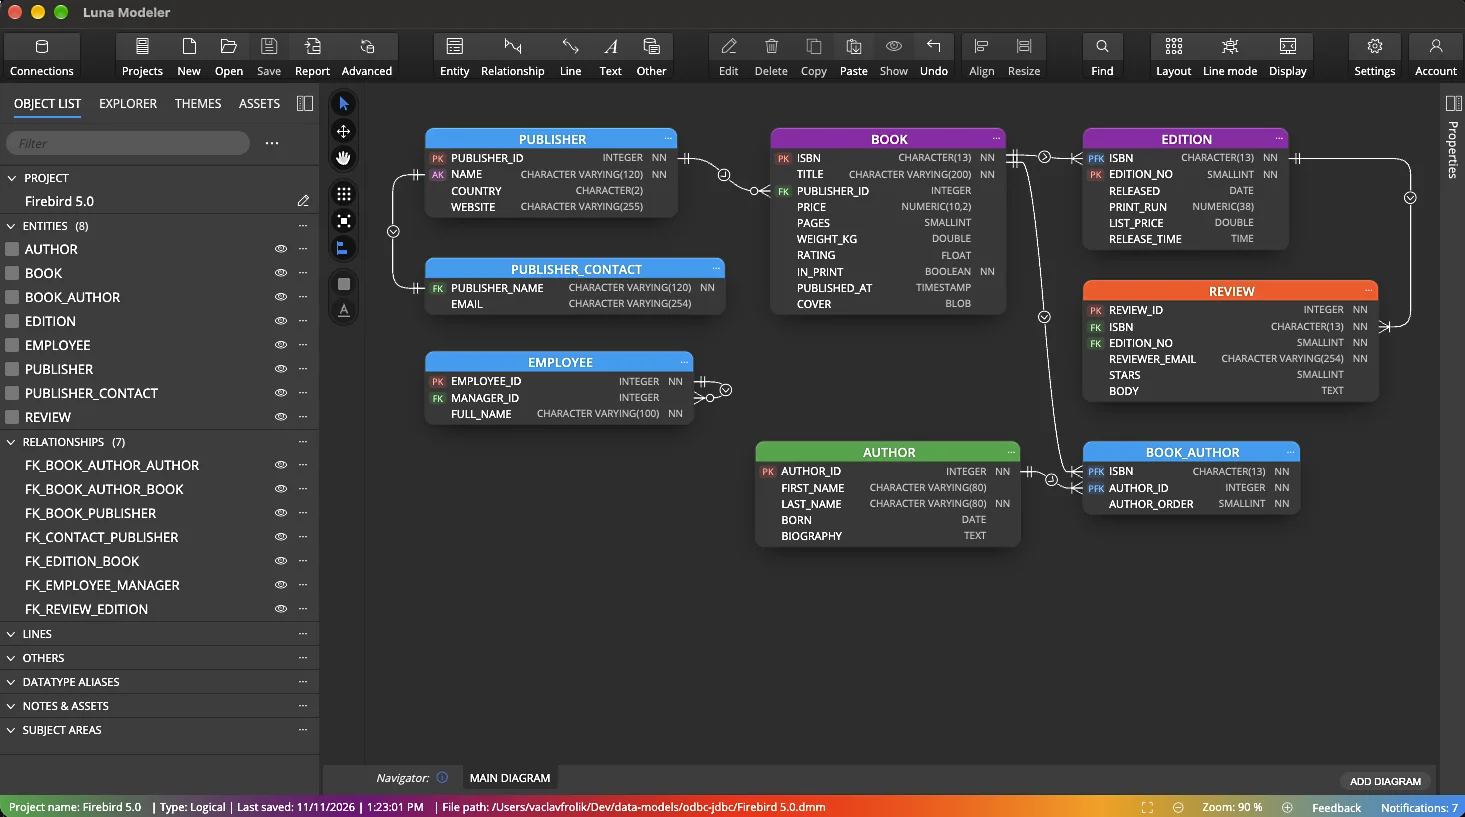
Luna Modeler connects to your database through the ODBC or JDBC driver and reads its structure. Tables, columns, primary and foreign keys and relationships are loaded into a logical data model with an ER diagram.
You do not need a dedicated connector for your database. The driver you already use for reporting or integration is enough.
The workflow: from driver to diagram
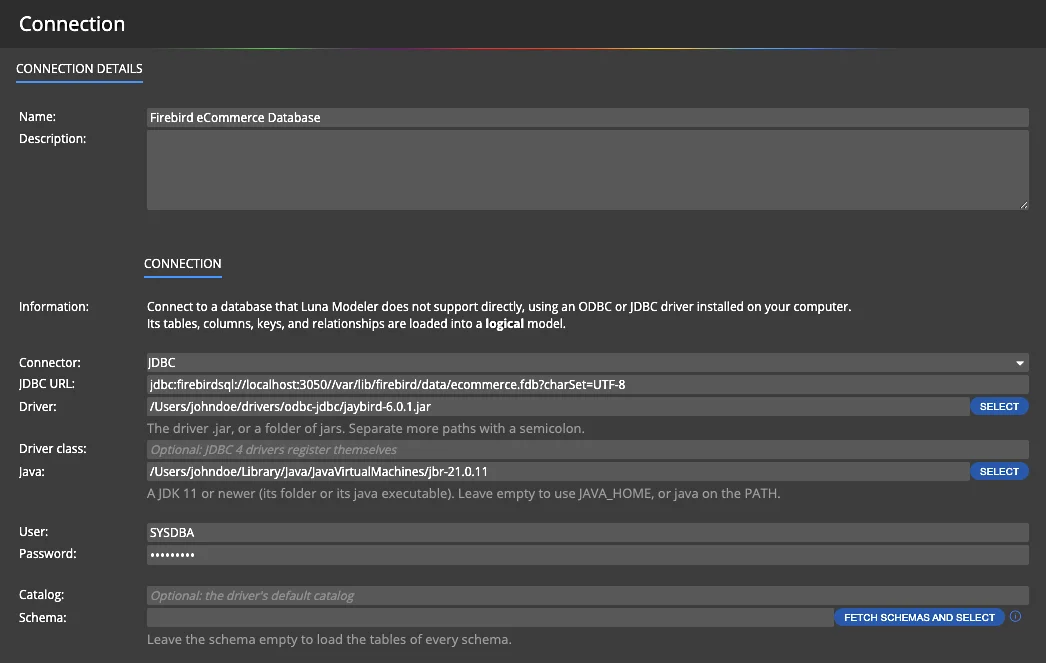
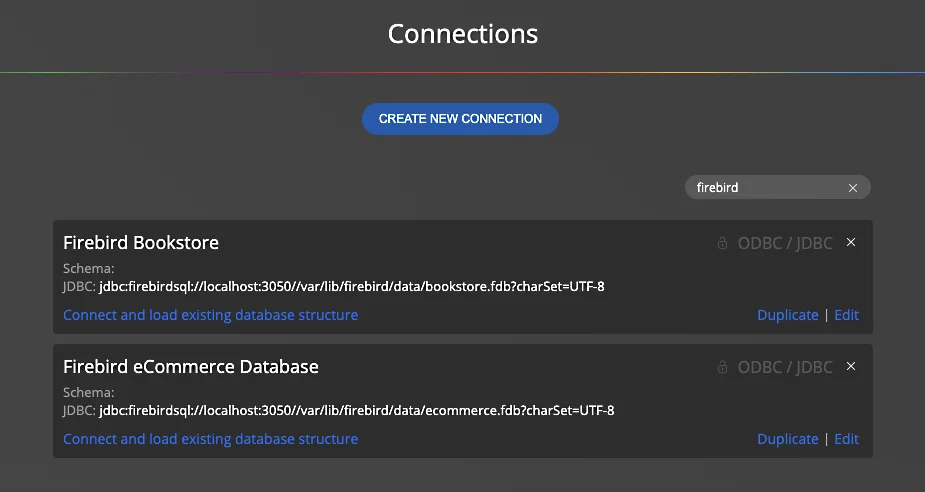
- Create a connection of the ODBC / JDBC type. Enter a DSN or connection string for ODBC, or a JDBC URL and the driver jar for JDBC.
- Pick the schemas you need, or load all of them.
- Load the structure with one click on Connect and load existing database structure.
- Arrange the diagram, add descriptions and notes, and group entities into subject areas.
- Share the model as an HTML report, a PDF or an image.
Document the database
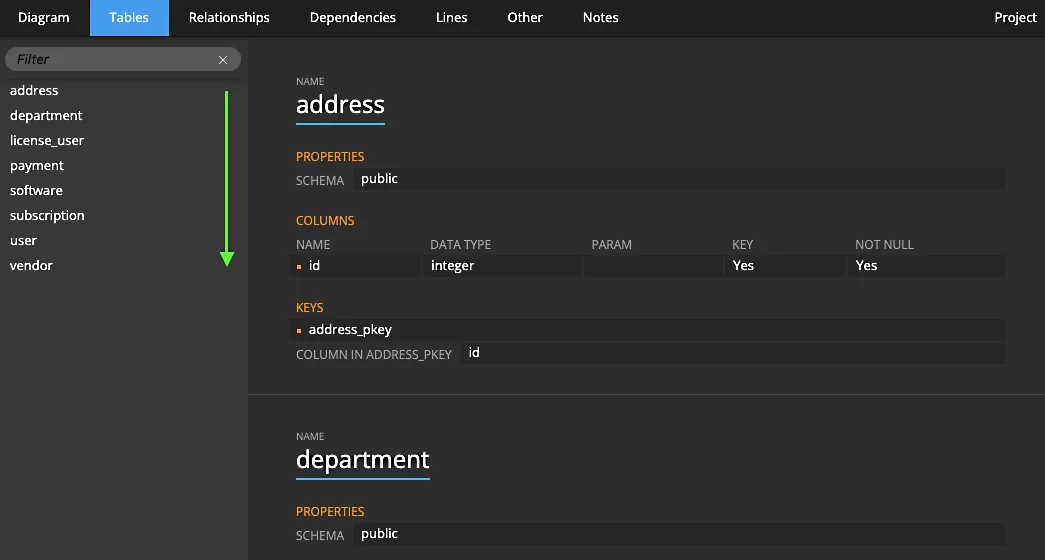
Turn the model into database documentation that people actually read. Add a description to every entity and attribute, then generate an interactive HTML report with the diagram, the list of tables, columns and keys, and a filter to find any table quickly.
The report opens in any browser. Nobody needs a database account or a driver to read it. HTML reports are available in the Professional edition.
Communicate with the whole team
A diagram is the fastest way to explain a database. Use it in onboarding, in design reviews and in conversations with business analysts who do not write SQL.
- Color entities by area or owner.
- Split a large model into sub-diagrams for each part of the system.
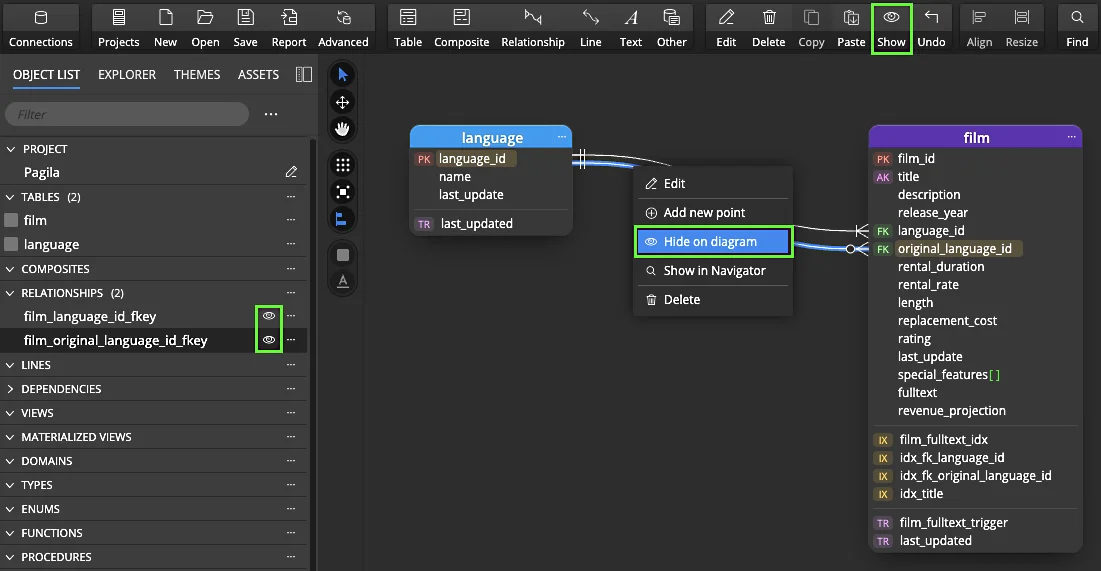
- Hide extra relationship lines to keep the diagram easy to read.
- Add notes that explain the business meaning of the data.
Keep the model current
Databases change, and outdated documentation is worse than none. With the saved connection, run update from database, review the differences and bring new tables and columns into your model.
Update from database for ODBC/JDBC models is available in the Professional edition.
What you get at the end
You get a logical data model of a database that never had a diagram before. The ER diagram shows every entity and relationship, descriptions and notes explain what the data means, and the HTML report lets everyone browse it.
Use it to onboard new colleagues, to plan a migration, to discuss changes with analysts or simply to finally have documentation for a system the company depends on.
Download the free trial, connect through your ODBC or JDBC driver and load your first model in minutes.
- Free 14 days trial
- No credit card required
.jar file and a JDK 11 or newer. See the setup guide.