Merit ModelerFree Data Flow Diagram Tool
- DFD elements ready to use Processes, data stores, external entities and flows
- Free, not a trial No licence to buy
- Levelled diagrams Keep the context diagram and its detail in one project
- Offline and private System documentation never leaves your machine
where does this data come from, and where does it go?
The problem: nobody can say how the data moves
Every system has a story that only exists in conversation. An export runs nightly, lands in a folder, gets picked up by a script, and ends up in a reporting database. Three people know one piece each, and nobody has the whole picture written down.
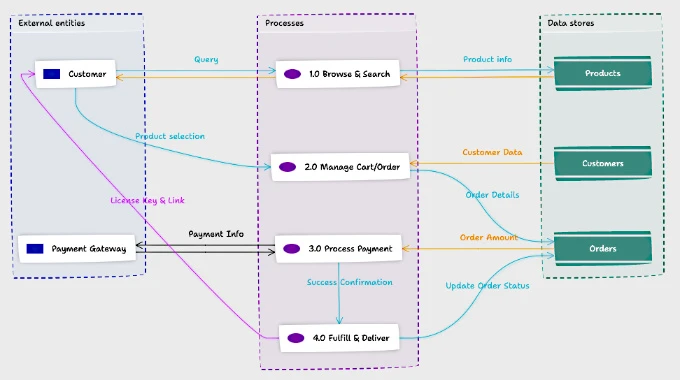
A data flow diagram is the written form of that story. It shows four things and nothing else: the processes that act on data, the stores that hold it, the external entities that send or receive it, and the flows between them. That restraint is what makes a DFD readable by people who do not write code.
The pain point: the wrong tool makes the wrong diagram
Drawn in a generic drawing app, a DFD drifts. A process becomes any rounded rectangle, a data store becomes whatever shape was nearest, and two diagrams of the same system end up using different symbols. Six months later nobody trusts either one.
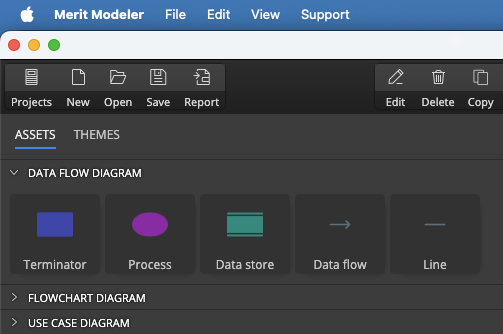
The notation exists to stop that. Merit Modeler puts the data flow elements on the assets panel as their own group, so a process looks like a process in every diagram you draw and a reviewer can read the picture without being told the key.
How Merit Modeler solves it
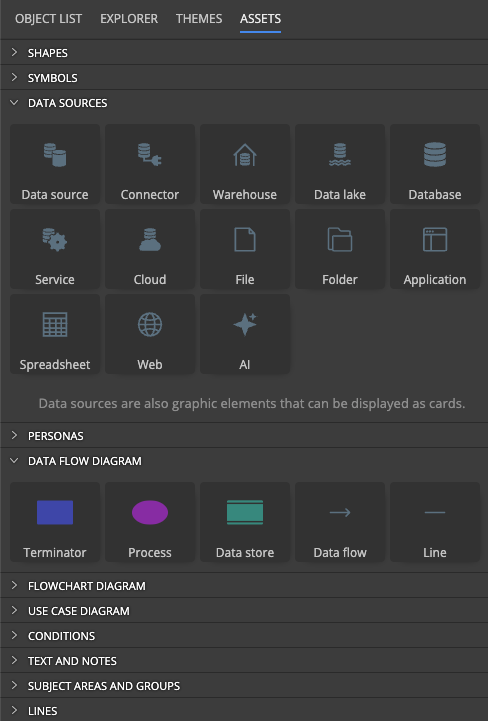
Merit Modeler keeps the DFD shapes, the connectors and the annotation tools in one free desktop application. Flows are drawn with connectors that stay attached when a process moves, so redrawing after a review does not mean rebuilding.
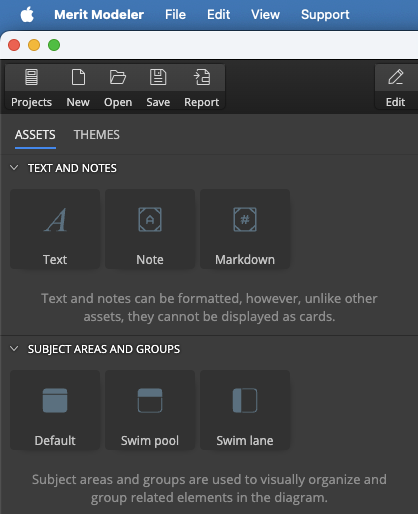
Subject areas and notes carry the parts of the story a shape cannot hold - the schedule an export runs on, the owner of a store, the reason a flow exists at all. Notes accept Markdown, so a paragraph of context sits beside the diagram rather than in a separate document.
Because a project holds several diagrams, the context diagram and the levelled detail below it stay together in one file instead of drifting apart in separate exports.
The workflow, step by step
A first data flow diagram takes about ten minutes:
- Start with the external entities - who sends data in and who receives it.
- Add the processes that act on that data, one shape per job.
- Place the data stores each process reads from or writes to.
- Draw the flows and label each one with the data that travels along it.
- Annotate anything a shape cannot say, then export the diagram.
Label the flows as you go. An unlabelled arrow is the most common reason a DFD stops being useful a month later.
A worked example is in the guide on creating a data flow diagram in Merit Modeler.
What you get out
An image or PDF you can put in front of an auditor, a new developer or a client, and a project file that stays on your own disk. When the system changes, you open the file and move a box - you are not rebuilding the diagram from a screenshot someone posted in chat.
Data flow diagrams sit naturally next to flowcharts, which show the order steps happen in, and use case diagrams, which show who the system serves.
Modelling the data itself? A DFD shows where data travels, not how it is stored. Luna Modeler designs the tables behind it and generates the SQL, and Moon Modeler does the same for MongoDB and noSQL.
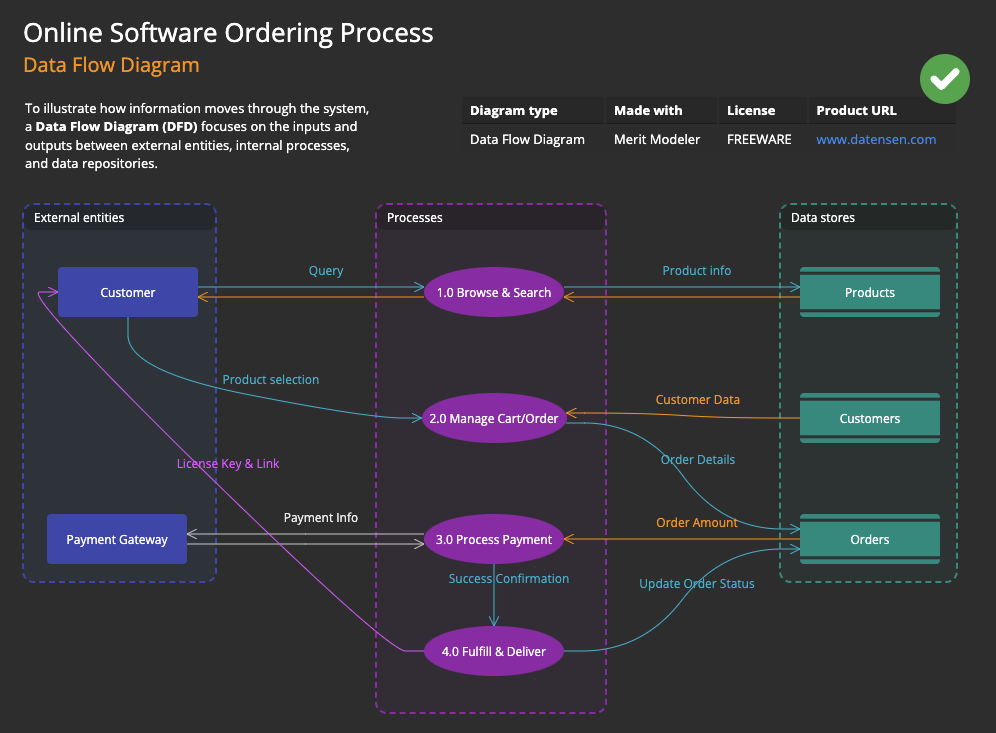
A data flow diagram shows how data moves through a system using four element types: processes that act on data, data stores that hold it, external entities that send or receive it, and the flows between them. It describes movement, not the order steps run in.
Yes. Merit Modeler is freeware with no licence to buy. It runs on Windows, macOS and Linux.
A flowchart shows the sequence of steps and the decisions between them. A data flow diagram shows where data comes from, what acts on it and where it is stored. The same system usually needs both.
Yes. A project holds several diagrams, so the context diagram and the levelled detail underneath it can live in the same file rather than in separate exports that drift apart.
No. Merit Modeler is a desktop application and every project is a file on your own disk. Nothing is sent to a server, which matters when the diagram documents an internal system.