Interactive HTML reports
Generating detailed documentation is one of the key features of Luna Modeler. For more information about the benefits of creating documentation, read Documenting Databases Using ER Diagrams
How to create an interactive HTML report for your data model
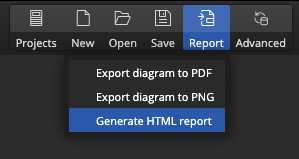
To create a new HTML report, open your project and click on the Report button on the main toolbar and choose Generate HTML report.
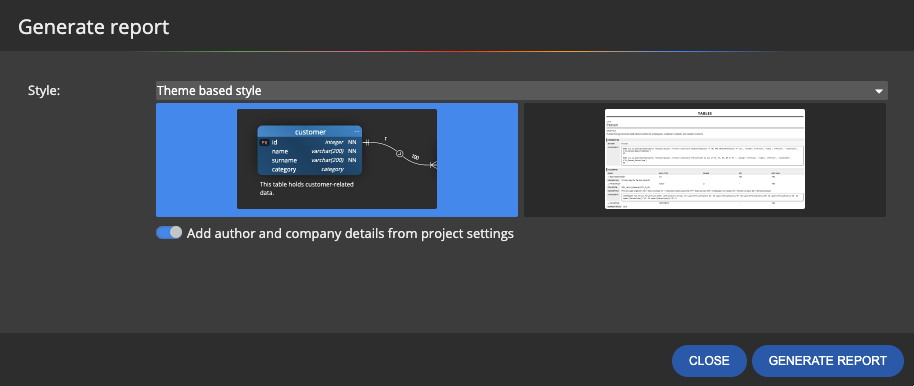
A new form opens. Select the report style and click Generate Report.
Select the target folder to save the report.
Example of generated HTML report
You can view the full report at: https://www.dbdiagrams.com/online-diagrams/subscription-tracking/
How to add the generated report to other sites?
Use the IFRAME tag. This might be the easiest way how to add the report to e.g. Atlassian Confluence.
#

Ideamerit s.r.o.
Czech Republic
European Union
ID No. 175 96 041
TAX ID No. CZ 175 96 041


Czech Republic
European Union
ID No. 175 96 041
TAX ID No. CZ 175 96 041