In this article, we will explain what a database diagram is, why it is useful, and how to create one.
What is a database diagram
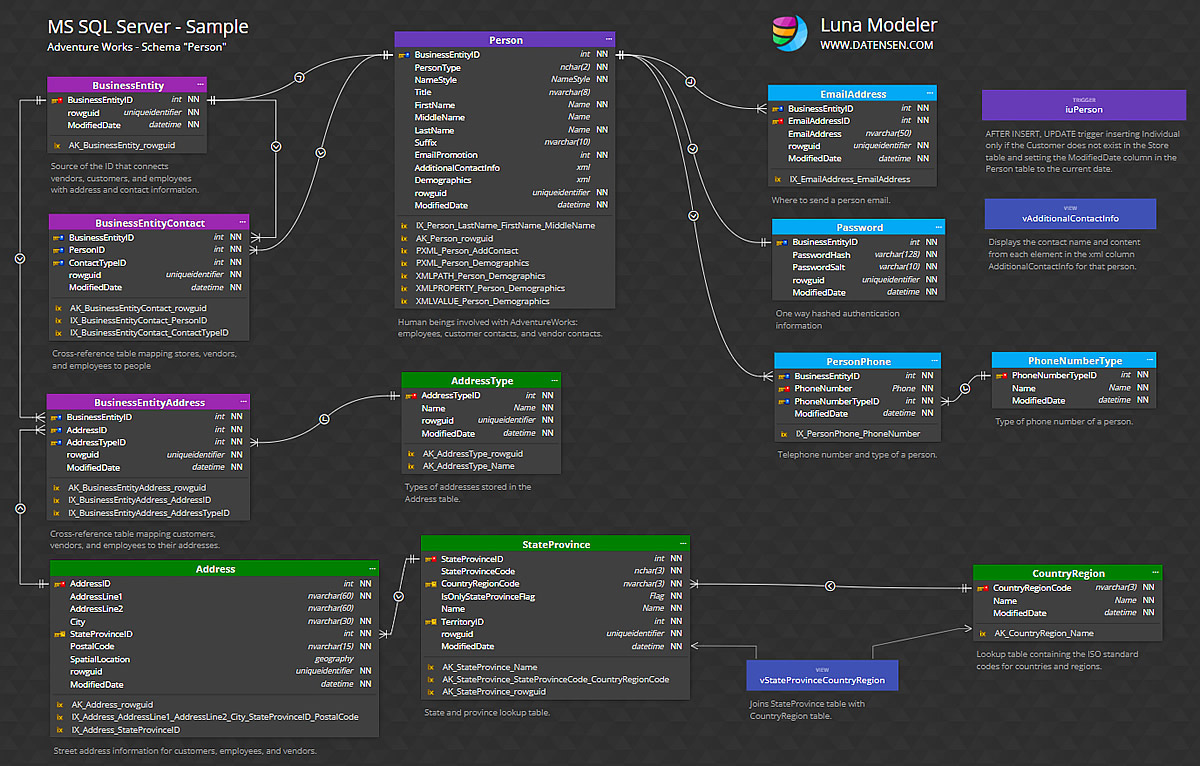
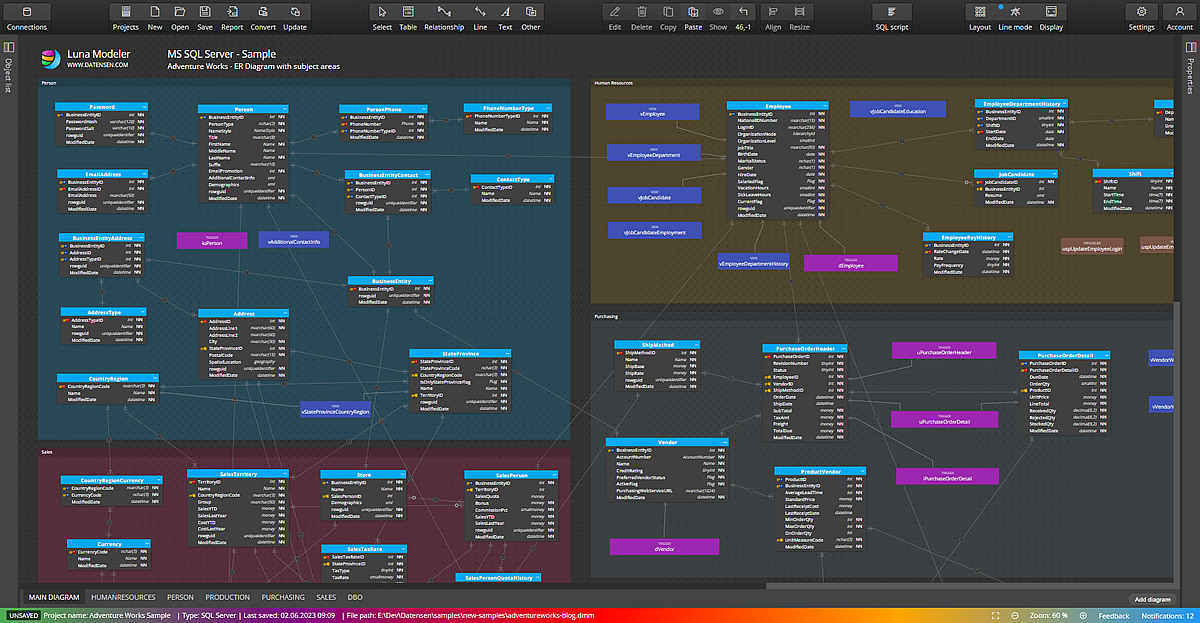
A database diagram is a visual representation of the structure and relationships among objects in a database. It shows the tables, columns, keys, indexes and other elements of a database together with other graphical information like notes, lines and subject areas. There are different types of diagrams and the most popular is entity-relationship diagram (ERD).

What are the benefits of a database diagram?
A database diagram can help you design, document, and understand your database better. It can help you with various tasks related to your database, such as:
- Planning and designing your database before creating it physically.
- Communicating your database design to other team members – developers, stakeholders, or clients
- Displaying the database structure specifically for selected target audience etc.

How to create a database diagram?
To create a database diagram, you can use various tools and methods, such as:
- Drawing tools: You can use general-purpose drawing tools, such as Microsoft Visio to create your database diagram manually. This gives you more flexibility and control over your design, but it can also be time-consuming and error-prone.
- Modeling tools: You can use specialized modeling tools, such as Luna Modeler, to create your diagram semi-automatically or automatically. You can create a new diagram from scratch or generate your database diagram from already existing database. This can save you time and effort.
Best practices
Regardless of the type and tool you use to create your database diagram, here are some best practices to follow:
- Use clear and consistent naming conventions for your database objects like tables, columns, keys, and relationships.
- Use appropriate symbols and notations for your database diagram, such as crow’s feet symbols or primary/foreign keys for relational schemas.
- Use colors and labels to distinguish different elements and categories in your diagram. You can also use subject areas for grouping items.
- Avoid overlapping objects and crossing lines to improve readability and avoid confusion. Ideally, use a visualization that shows relationships as lines that connects a primary key column in parent table with a foreign key column in child table.
- Document your assumptions in your diagram using comments or notes.
Conclusion
A database diagram is a useful tool for designing, documenting, and understanding your database. By following the steps and best practices outlined in this article, you can create a high-quality diagram for your project.
