Get to know the basic elements in the user interface of Moon Modeler, a database design tool for noSQL databases.
The main toolbar is a key element. From this toolbar, you can navigate to pages with projects, database connections, settings, etc.
1. Projects
You save your projects on your computer. No cloud services are used for storage, whatever you create is under your control. For easier access to your saved files, there is a Projects section where you can find a list of the projects you have created and saved.
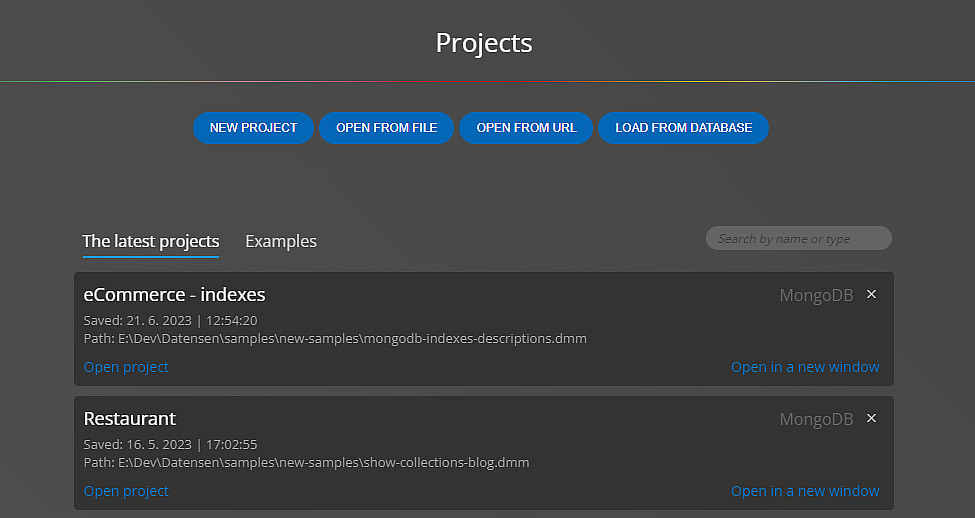
Tip: Details of the active project are shown in the footer.
2. Connections
You can create and save database connections in Moon Modeler. This information is also stored on your device – and is encrypted. In the Connections section you can find all the database connections you have created. Here you can edit them, adjust settings, or delete them completely.
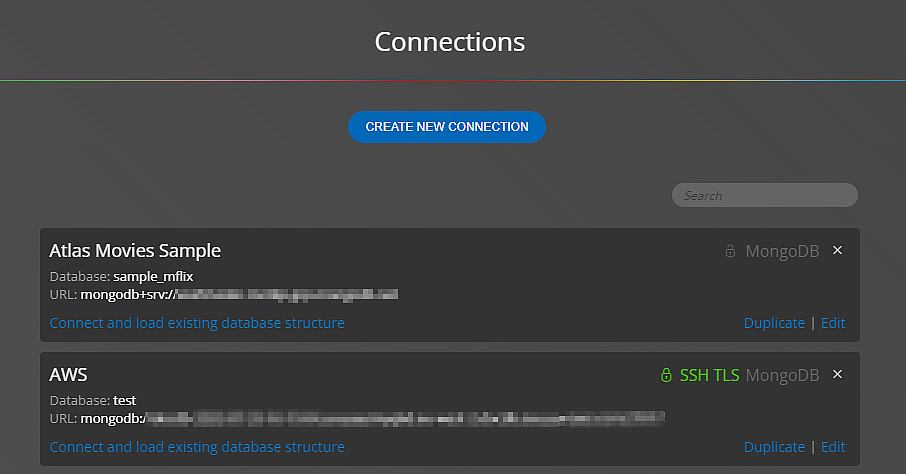
You can then use existing database connections to load and visualize your existing database structures.
3. Settings
On the Settings page you can change the theme, set the number of UNDO steps, where to display tabs with diagrams and other options.
4. Account
On this page, you will find information about the software and the user, and you can also easily activate your license here.
5. Display & Diagram settings
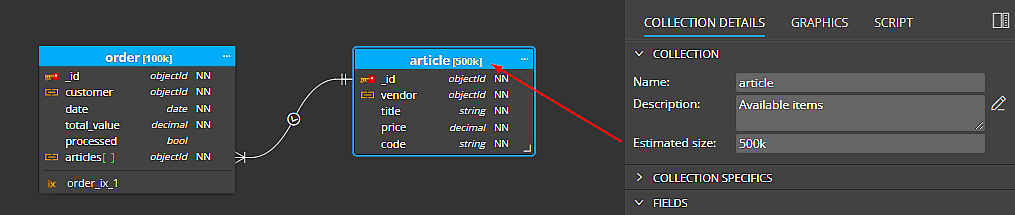
By default, main objects, e.g. collections and fields with data types are displayed, however you can also display descriptions, indexes etc. To change the visualization, click the Display button and select the desired option. You can also click the diagram area and set the settings in the side panel.
Display descriptions
When enabled, your collection descriptions are displayed below collections.
Display estimated sizes
You can also enable displaying of estimated sizes in the diagram.
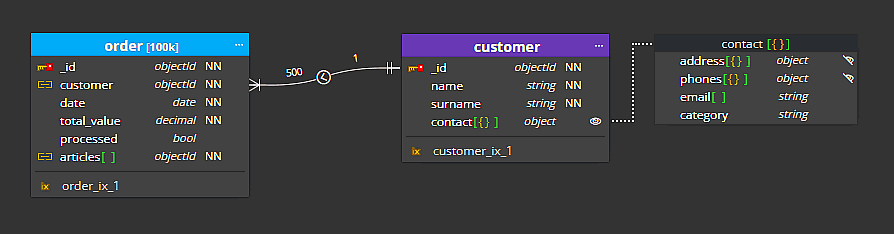
Display cardinality captions
It can be useful to view additional information near reference lines. Whether it is simple information indicating the maximum number of records, or information containing advanced quantification – the minimum number, the most likely number and the maximum number of records. You can also specify just the max number of records and keep the visualization simple.
Enable the Display cardinality captions option to see the captions in your diagram.
6. Line modes
In Moon Modeler it is possible to switch between two modes of line drawing. Simple and Detailed.
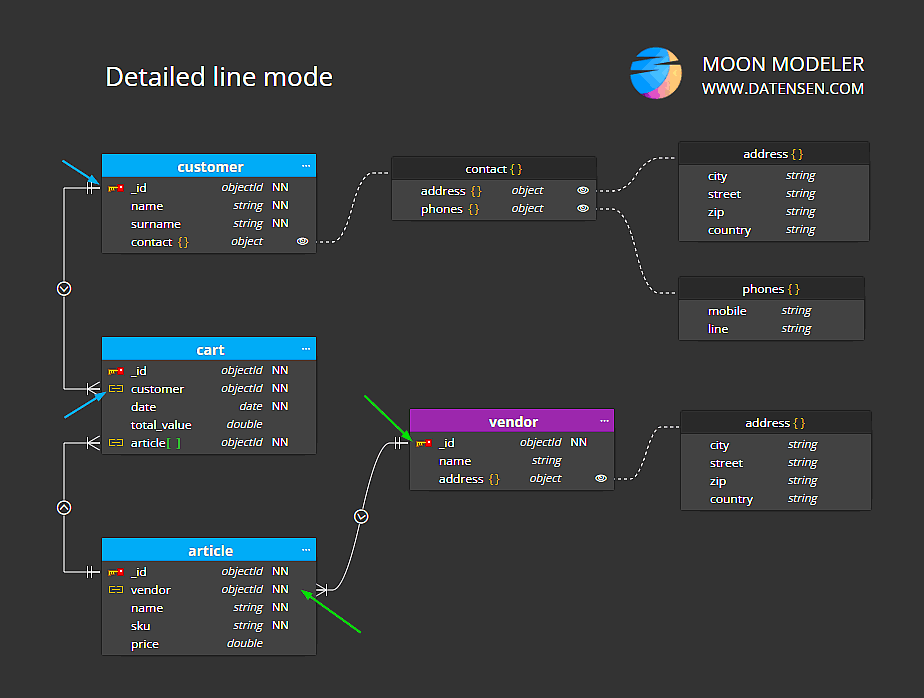
Detailed
In Detailed mode, the line is drawn from field to field.
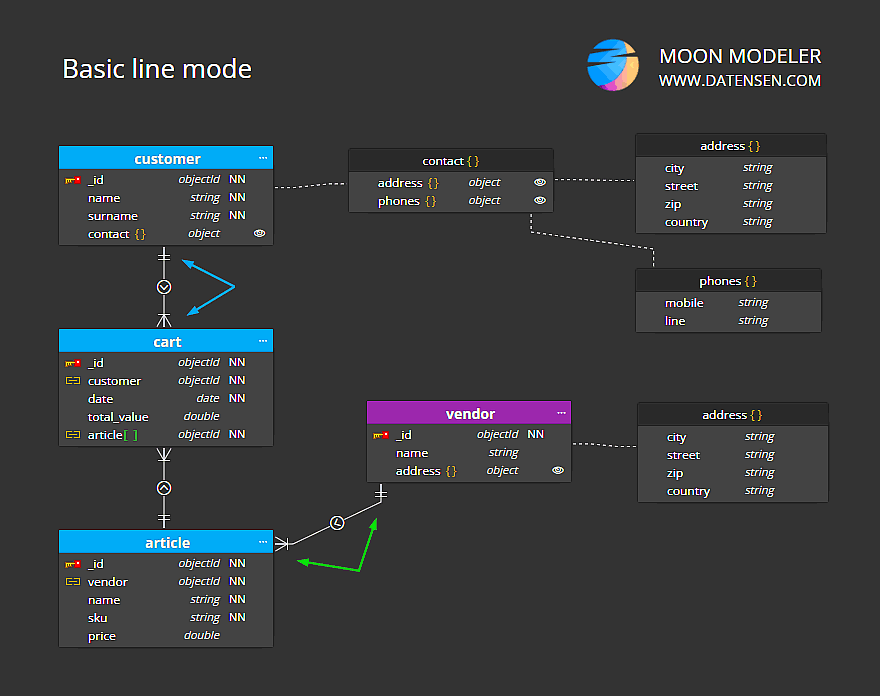
Simple
In Simple mode, the line is drawn from a collection to another collection (or another object).
Containment lines to objects
In Moon Modeler, containment lines to defined contained objects are drawn automatically and have the dotted style.
7. Object grouping and alignment
Moon Modeler features include automatic temporary grouping of contained objects.
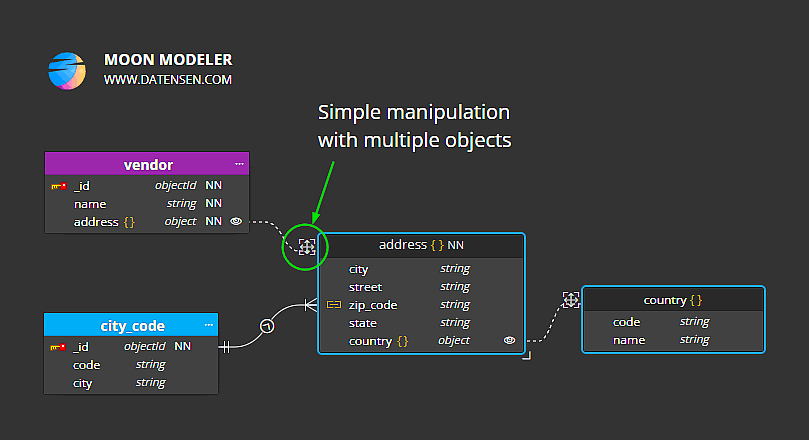
This feature allows easy manipulation of multiple objects in a diagram. If you want to manually change the position of the contained objects, you can easily rearrange the boxes and change the layout.
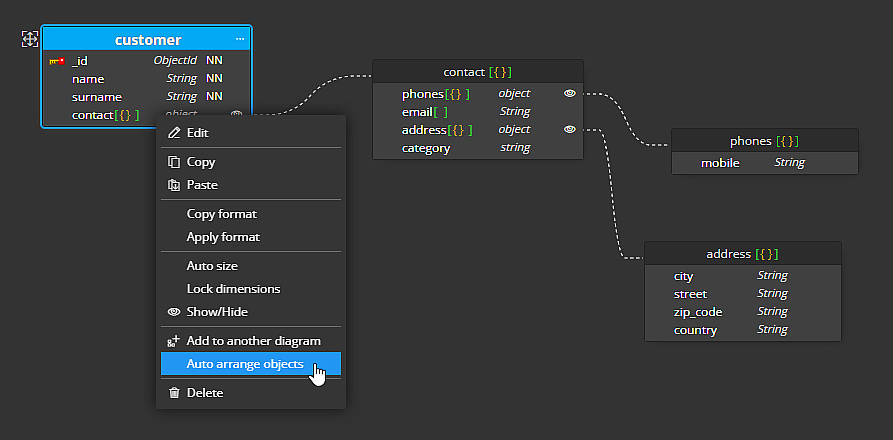
To reset the layout of contained objects, select a collection and choose the Auto arrange objects item from the context menu.
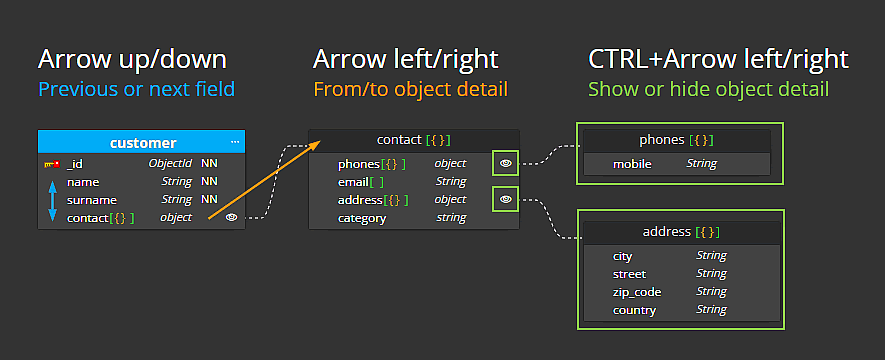
8. Keyboard navigation in diagrams
- Use the up and down arrows to easily move to the previous or next field.
- Use the right or left arrows to move to/from the object detail.
- And if you want to show or hide the detail, just press the CTRL key in combination with the right or left arrow key.
9. Panels
The user interface contains two side panels. On the left is the list of objects, change themes or use the Explorer for managing versions. On the right, you can edit the properties of the project, diagram or selected object.
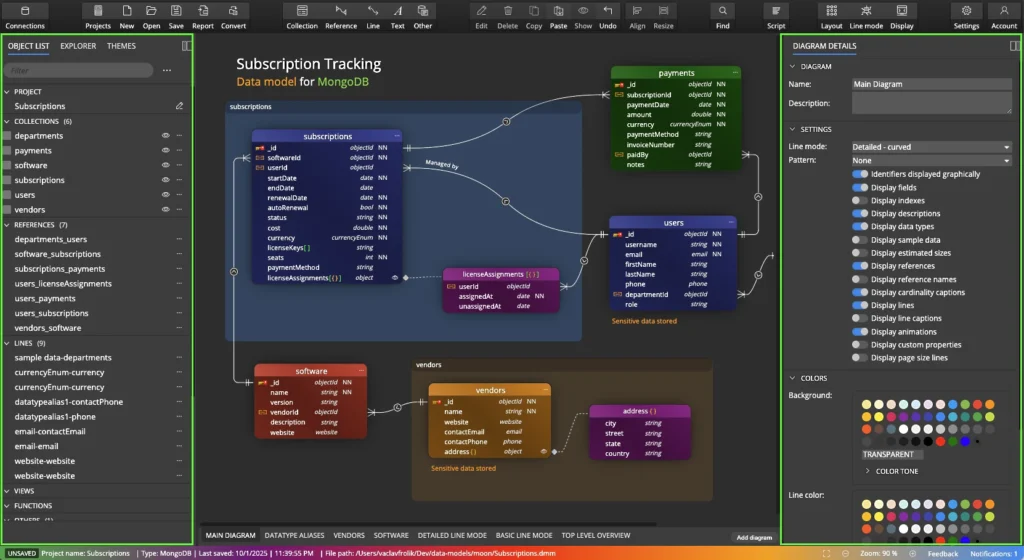
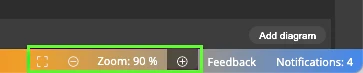
10. Footer
The bottom section displays information about the project type, whether it is saved, and also a panel for changing the zoom level.
#
