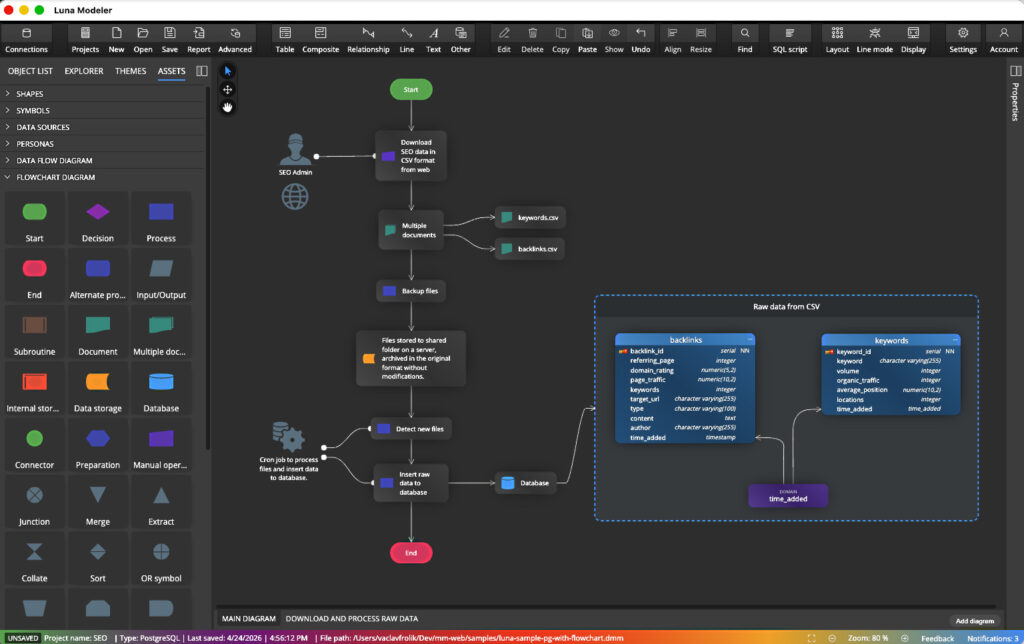
Luna Modeler helps you design relational databases without the headache. While it’s built for visual database design, it’s also flexible enough to handle the “why” behind your data, not just the “where.”
What you can do:
- Design visually. First and foremost, you can build out your database structures using a clean, intuitive interface.
- Add context. Diagrams are great, but sometimes they need more detail. You can easily enrich your models with notes, custom text, and shapes to explain your logic.
- Map out the flow. Beyond standard ER diagrams, you can now drop in flowcharts and data flow elements. This means you can track how data actually moves through your system.
- Centralize everything. Instead of jumping between different apps, you can keep your technical schema and your business logic in one place.
The result? You get a database model that actually tells the whole story, making it much easier for the rest of your team to jump in and understand what’s going on.
Adding Graphics, Flowchart or Data Flow Diagram Elements
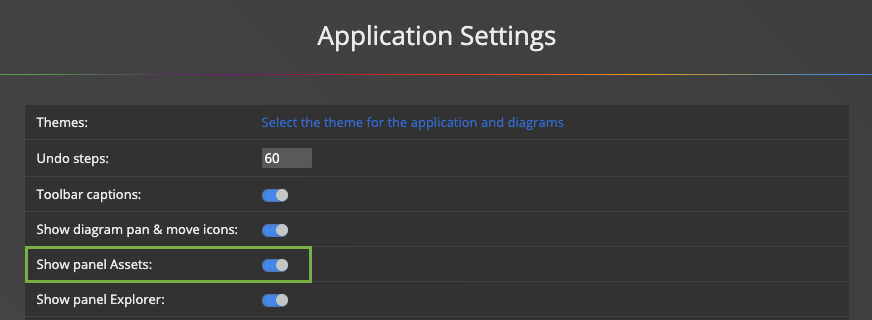
To use these elements, simply enable the Show panel Assets option in the Application Settings.
Predefined elements will appear in the Assets panel on the left. To add a new item to your diagram, simply select an object by clicking on it, and then click the diagram area.
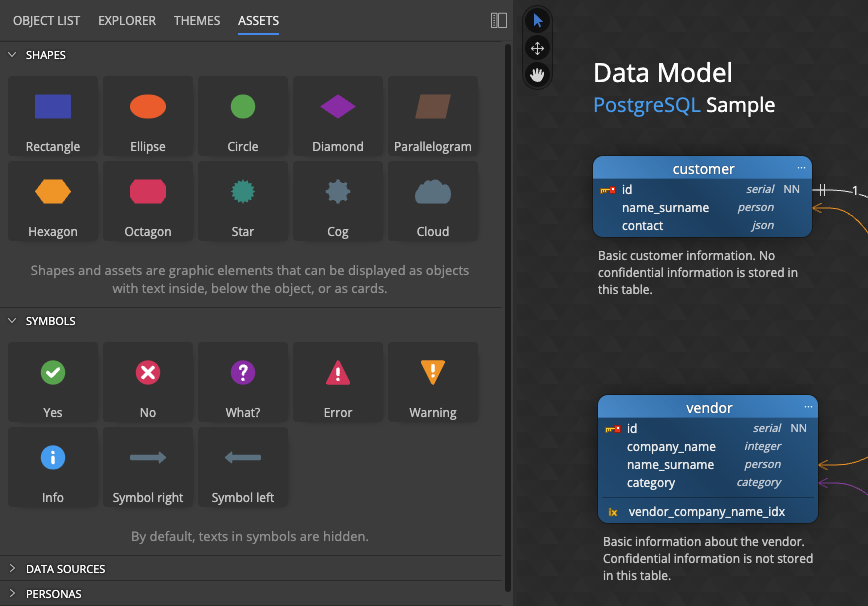
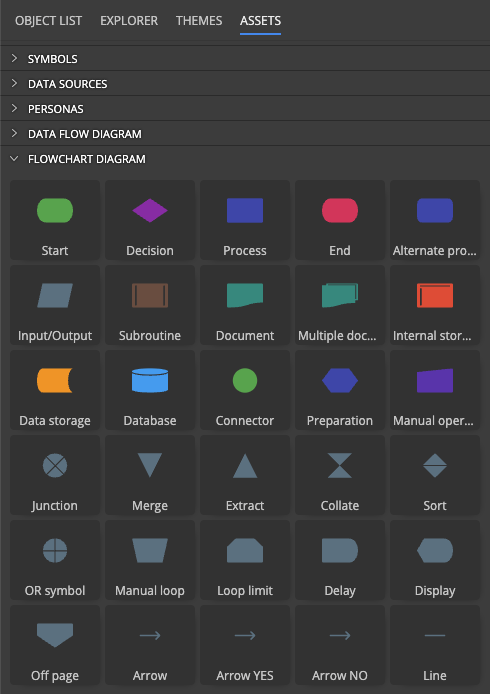
Predefined Shapes, Symbols and Data Source Graphics
We have prepared various graphic elements to help you better communicate your data models. Among the assets, you will also find elements such as Data Sources and Data Flow Diagram elements. This allows you to add information about how data flows and, for example, which tables the data is loaded into or saved to at a given point in time.
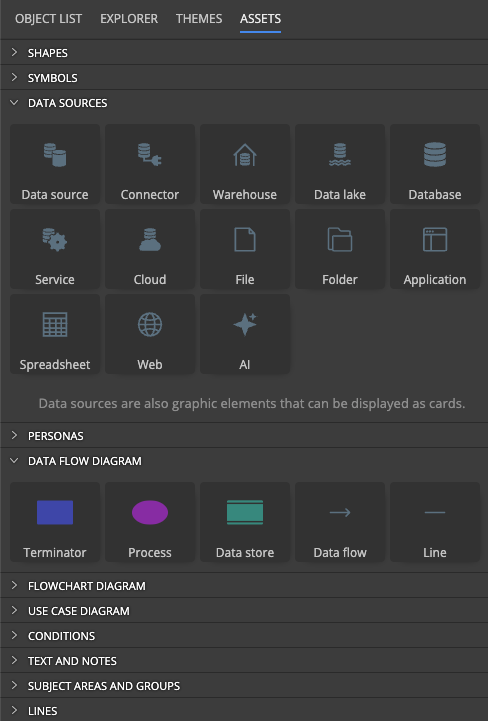
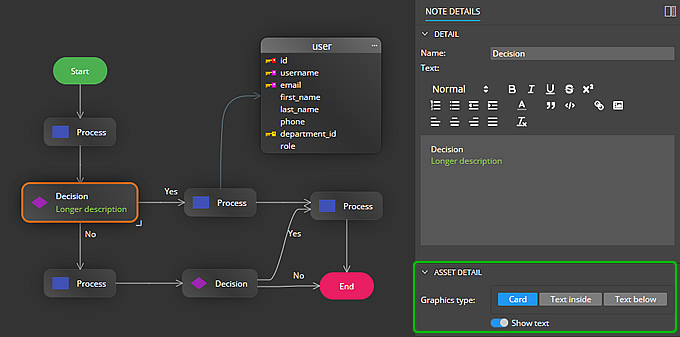
Flowchart Diagram Elements
Most objects added from the Assets panel can be displayed as Graphics or as Cards.
Subject Areas, Swim Pool and Swim Lane Elements
To improve your visualizations, you can add to your diagrams elements such as Swim Pool and Swim Lane. Work with these objects in the same way as with Subject Area. The only difference is in the visualization. You also have the option to set the color and style of the border.

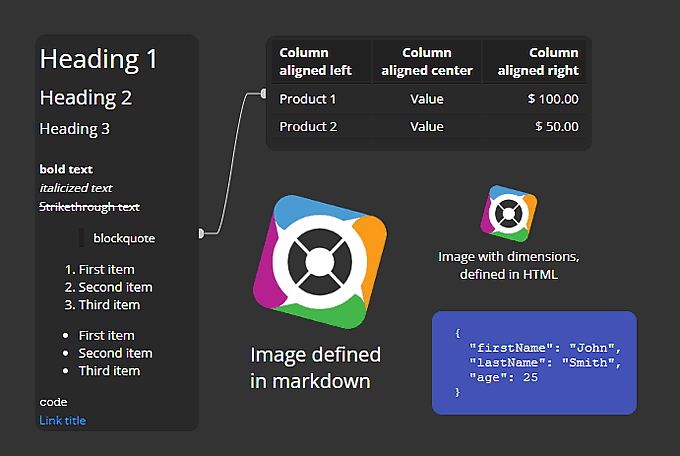
Text, Notes and Markdown Notes
In addition to classic texts and notes, you can add Markdown notes to the diagram, which support classic markdown and some HTML elements. This makes it easy to create a table, list, or add an image with a specific size.
The Benefits
The biggest advantage is simple: it bridges the gap between structure and logic.
While a standard ER diagram shows you what the data looks like, adding flowcharts and DFDs explains how that data actually moves and changes. By combining these elements, you create a “single source of truth” where:
- Context is instant: You don’t have to guess why a table exists; the flowchart next to it explains the business process it supports.
- Handoffs are seamless: Developers see the schema, while stakeholders follow the visual flow – all on the same canvas.
- Complexity is simplified: You can use symbols and notes to highlight specific data privacy zones (like GDPR) or external API integrations right where they happen.
Essentially, you aren’t just documenting a database; you’re documenting the entire lifecycle of your data in one readable map.
#
