Flowchart diagrams remain one of the most effective ways to visualize processes, decisions, and workflows. A clear flowchart diagram helps you understand and present complex ideas at a glance.
In this guide, you’ll learn:
- What a flowchart diagram is
- Why flowcharts matter in modern workflow design
- How to create a flowchart diagram using Merit Modeler, a powerful freeware desktop tool
- A simple sample flowchart you can recreate
- Where to download Merit Modeler for Windows, Linux, and macOS
What Is a Flowchart Diagram?
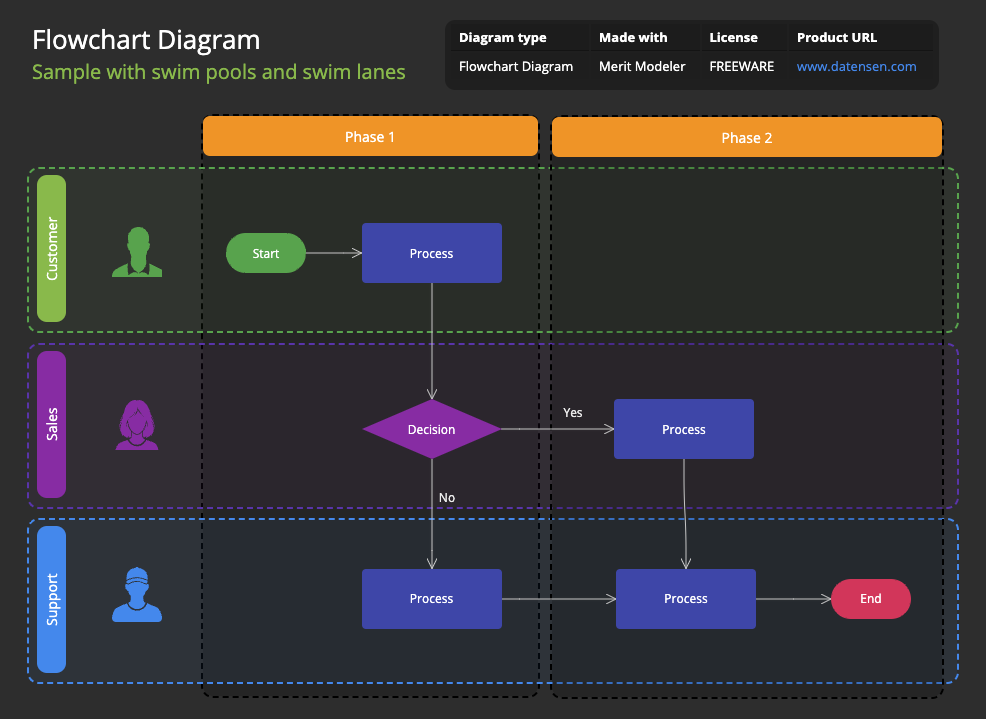
A flowchart diagram is a structured visual map that illustrates the steps of a process. It uses standardized shapes – rectangles for processes, diamonds for decisions, ovals for start or end points – and, of course, directional arrows to show the flow from one step to the next.
Flowcharts are widely used for:
- Business process modeling
- Software development and algorithm planning
- Quality assurance and compliance documentation
- Customer journey mapping
- Training and onboarding
A well‑designed flowchart diagram helps teams understand how a process works and communicate ideas with clarity.
Meet Merit Modeler: A Free, Cross‑Platform Flowchart Diagram Tool
If you need a free flowchart diagram tool that’s powerful, lightweight, and easy to use, Merit Modeler is an excellent choice.
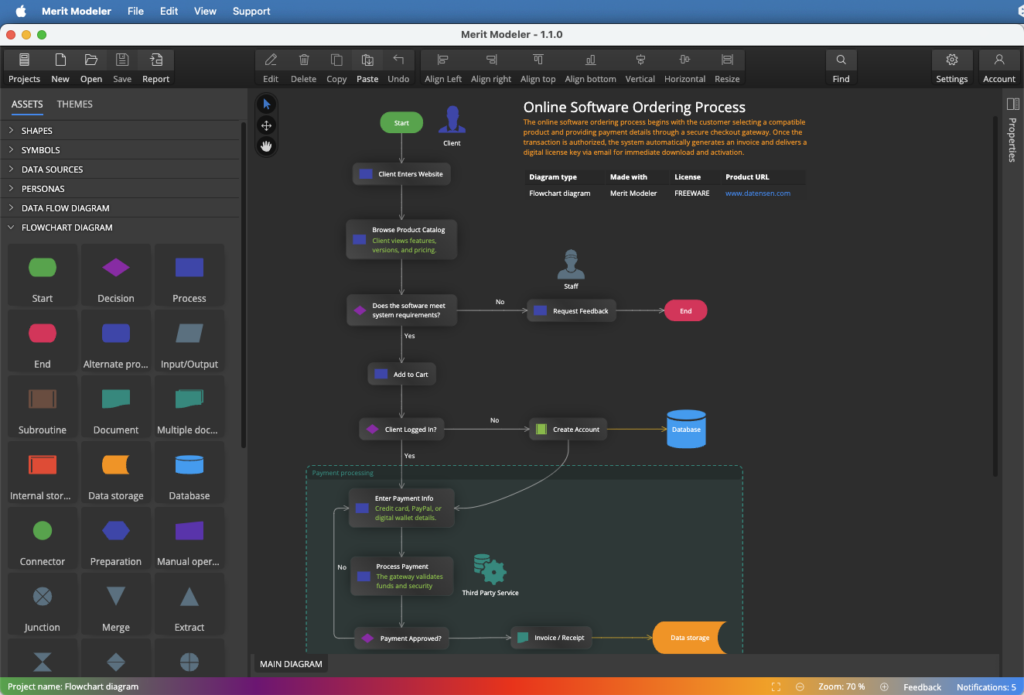
What Is Merit Modeler?
Merit Modeler is a freeware desktop application for creating flowcharts, process diagrams, data flow diagrams, use case models and other visualizations. It runs on:
- Windows
- Linux
- macOS
You can download it from the Downloads section at: datensen.com
Key Advantages of Merit Modeler
- Completely free to use
- Cross‑platform compatibility
- Clean, intuitive interface
- Fast performance
- Ideal for beginners and advanced users
- Supports exporting diagrams for documentation and presentations
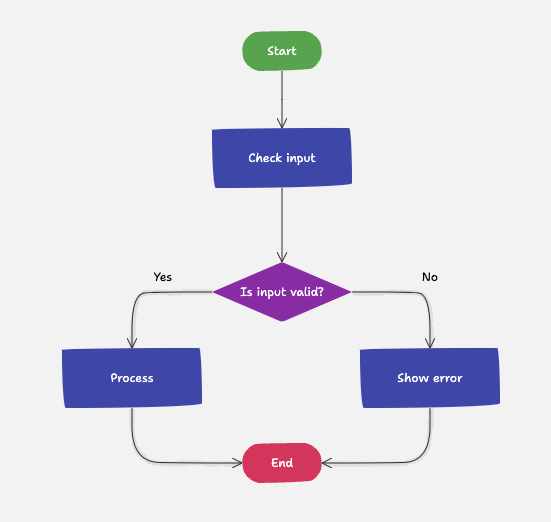
Simple Flowchart Diagram Example
Below is a basic structure you can recreate in Merit Modeler.
How to Create a Flowchart Diagram in Merit Modeler
Here’s a straightforward workflow to help you build your first flowchart diagram.
1. Create a New Project
Download and install Merit Modeler. Start the application and create a new project of type Diagram.
2. Add the Start Symbol
Select the start shape from the Assets panel and place it at the top of your diagram canvas.
3. Insert Process Steps
Click the process symbol in the Assets panel and then click the diagram canvas to add a new process. Add short, descriptive labels such as “Check Input”.
4. Add a Decision Point
Use the diamond shape to represent a decision. This is where the flow splits into different paths based on a condition.
5. Connect the Shapes
Use lines with arrows to link the shapes in the correct order. Arrows define the direction of the process and help readers follow the logic.
6. Add the End Symbol
Place the end shape at the bottom of the diagram and label it “End.” This marks the conclusion of the workflow.
7. Adjust Layout for Clarity
Align shapes, space them evenly, and keep the flow moving top‑to‑bottom or left‑to‑right. A tidy layout makes the diagram easier to read.
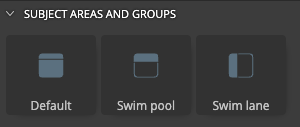
Tip: Use a subject area (default), swim pool or swim lane objects (rectangular frame) to outline the scope.
8. Save or Export Your Diagram
Save your project and export your flowchart diagram for documentation, presentations, or team discussions.
Tips for Designing a Clean, Effective Flowchart Diagram
To make your flowchart easy to read and visually appealing:
- Keep spacing consistent
- Use a clear top‑to‑bottom or left‑to‑right flow
- Limit branching to avoid clutter
- Use concise labels
- Stick to a consistent color scheme
Good design improves comprehension and makes your diagram more professional.
Why Flowchart Diagrams Matter
Flowcharts remain popular because they:
- Turn complex workflows into simple visuals
- Improve communication across departments
- Reveal bottlenecks and redundancies
- Support documentation and audits
- Provide a universal visual language
A strong flowchart diagram becomes a single source of truth for any process.
Final Thoughts
A flowchart diagram is one of the most effective tools for visualizing processes. With Merit Modeler, you can create professional‑quality diagrams without paying for expensive software. The application is free, fast, and available for all major operating systems.
Download Merit Modeler and start building your own flowcharts today.
FAQ
A flowchart diagram is a visual representation of a process. It uses shapes such as rectangles, diamonds, and arrows to show steps, decisions, and the flow of actions.
Flowcharts typically use start/end symbols, process boxes, decision diamonds, connectors, and arrows. Each symbol represents a specific type of action or decision.
Create a new model, place the required shapes on the diagram canvas, connect them with arrows, and label each step. Merit Modeler’s interface makes it easy to build clean, structured flowcharts. Merit Modeler provides all required elements in its Assets panel.
Yes. Merit Modeler is completely freeware and available for Windows, Linux, and macOS. You can download it from datensen.com
Yes. You can export your flowchart diagram for documentation, reports, or presentations.
Everything you create stays with you. Your data is yours and everything is completely under your control.
Flowcharts are useful for business analysts, developers, project managers, trainers, and anyone who needs to visualize a process clearly.
