PostgreSQL ER diagram - graphics
PostgreSQL entity relationship diagrams (ER Diagram) graphics can be defined in Luna Modeler on three levels. Global graphics can be specified on a project level, you can modify colors on diagram level and properties can be modified also on selected object level.
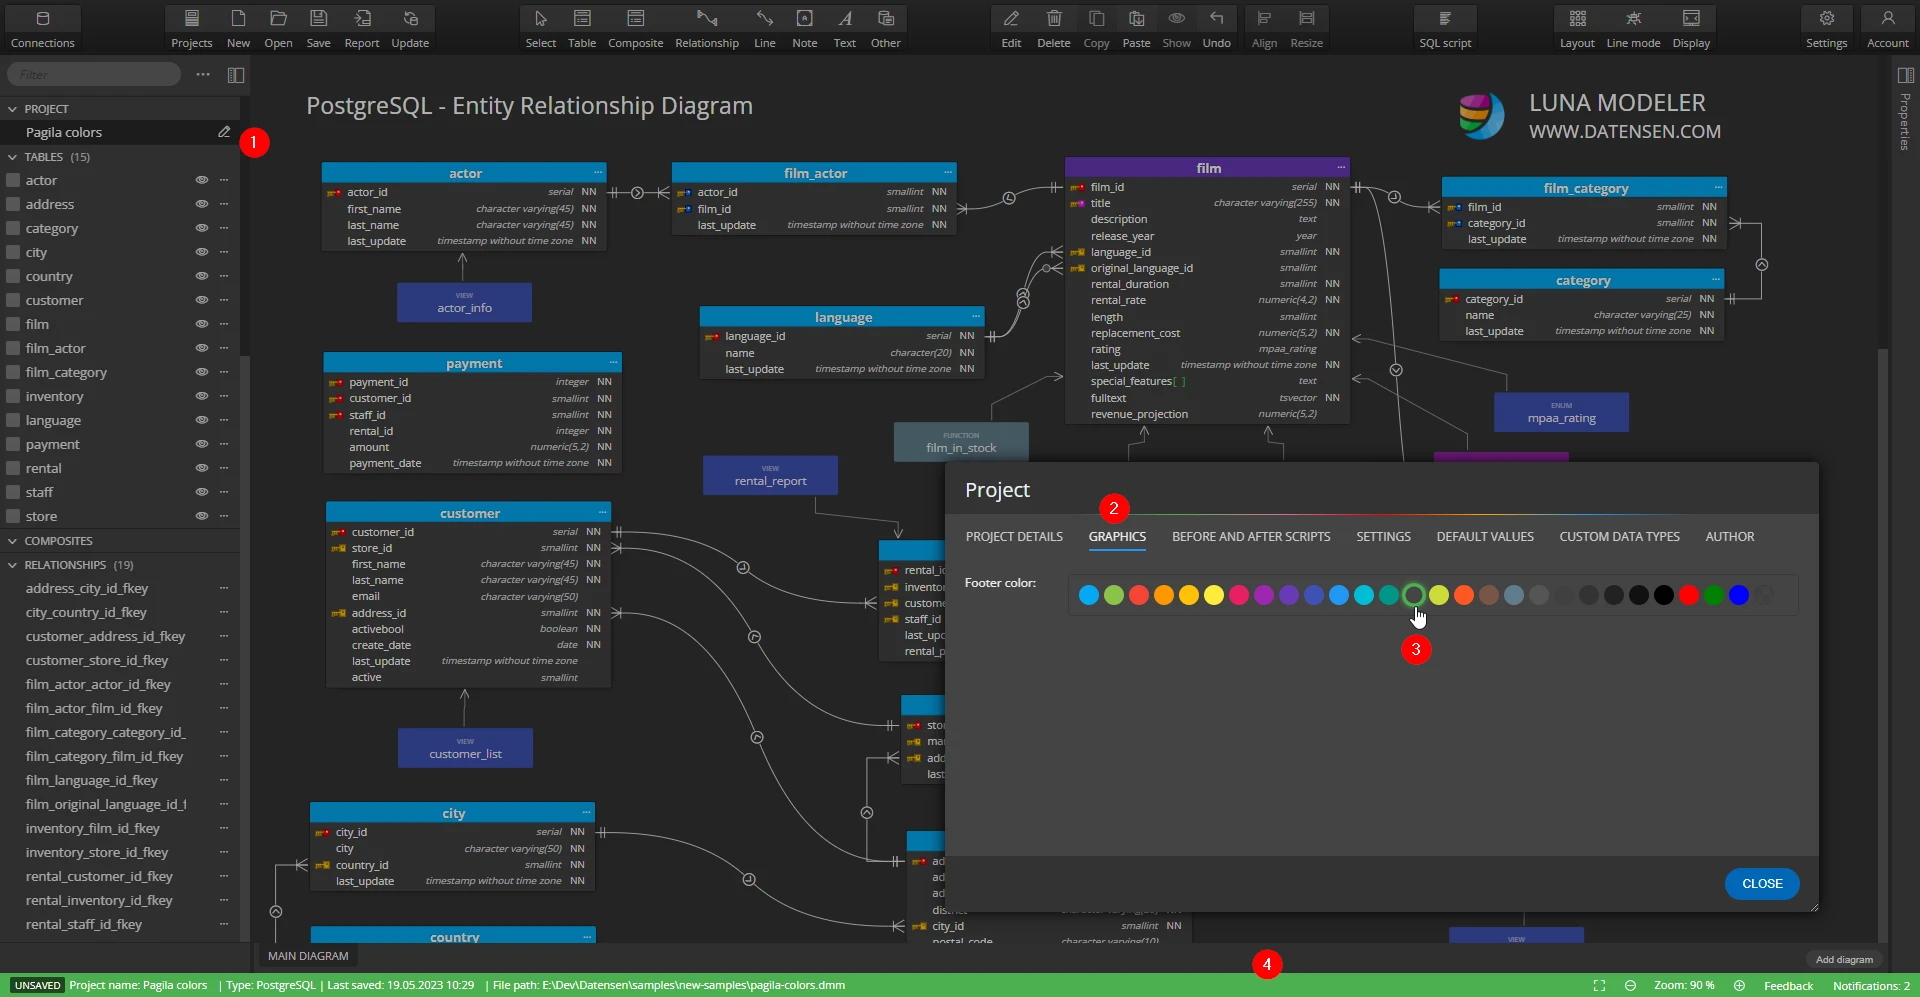
Colors and graphics defined on the project level
If you wish to change background color, line color or footer color (e.g. for easier recognition of the project you currently work with), click the ER diagram area to make sure no object is selected. Then change the colors in section Graphics.
If you wish to maximize the diagram area, close the side panel. The graphics settings can also be changed on the Project form. To open the modal form, double-click the project name. Then click the tab Graphics and change the colors or other settings.
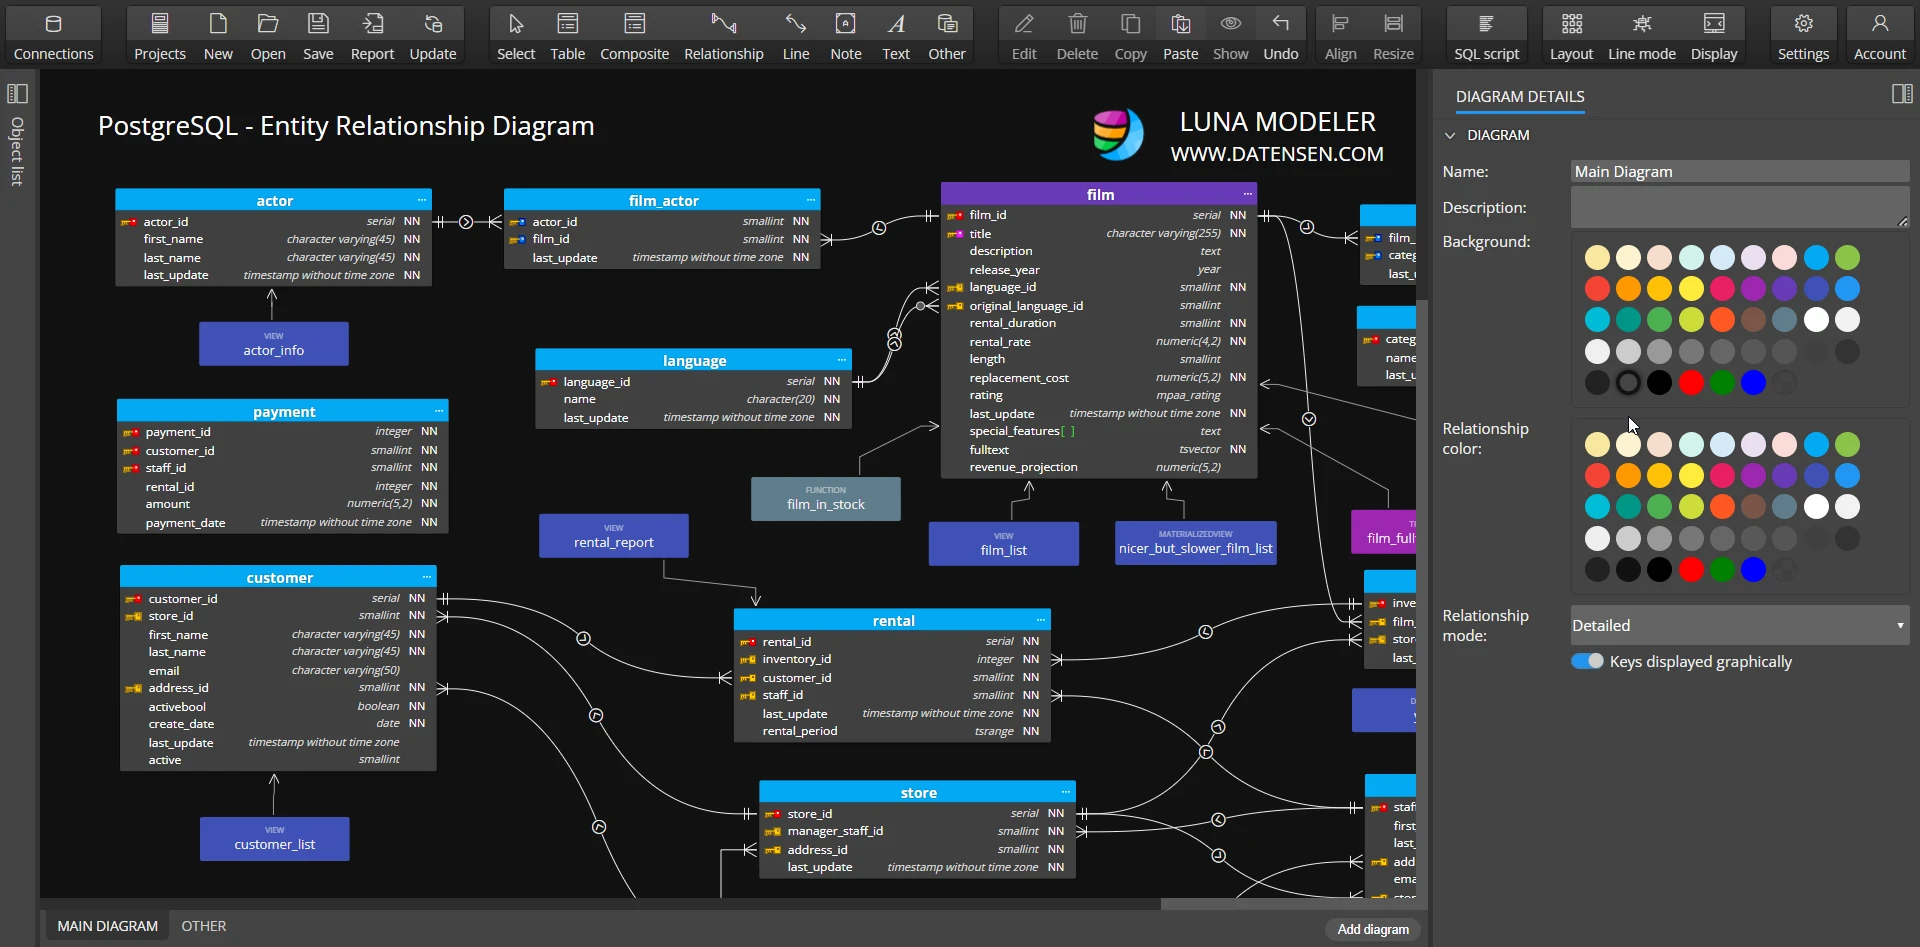
Graphics on the diagram level
Click the diagram area to display diagram properties in the right side panel. Change background color, relationship color and choose the relationship mode etc.
PostgreSQL ER diagram and on the selected object level
Color for the selected table, composite type, enum, domain, function and other objects can also be specified in section Graphics. To change colors, select an object and specify values in the right-side panel.
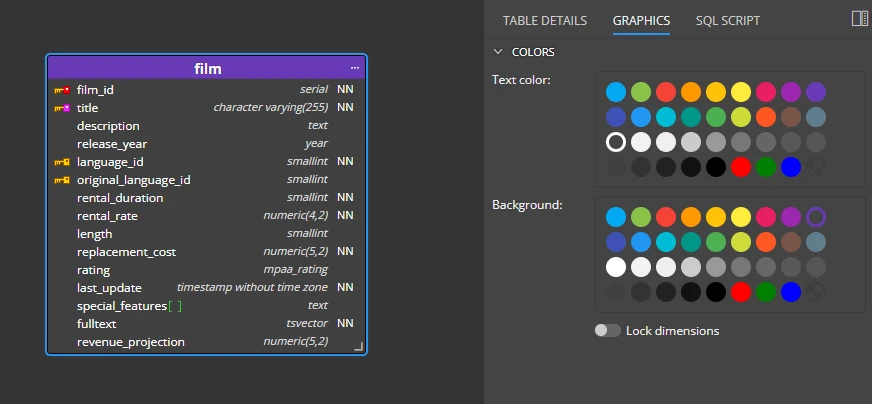
Of course, you can also edit any object by double clicking its graphical representative and change the text color or background color on the tab Graphics.
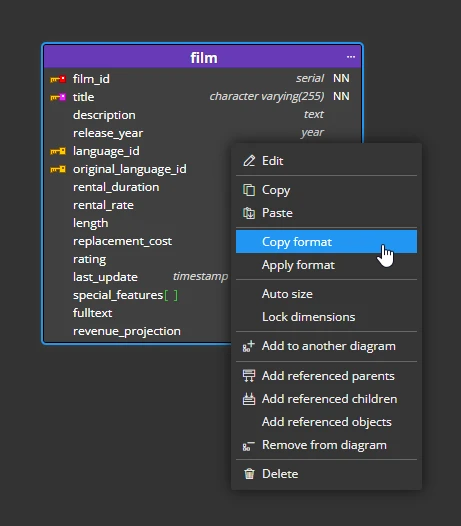
Note: graphics/settings can be also copied and applied to other objects easily.
#PostgreSQL ER diagram & graphics
