Database reporting and creation of HTML reports
Note: this page is outdated. Please visit page Interactive HTML reports & Database reporting
Key benefits of the generated HTML reports
- HTML and SVG format – high quality format of the graphics and lines.
- Interactive diagrams – click on any item in the diagram to open the detail.
- Searchable pages – click on an object type in the main toolbar to display a list of all objects and use the Search field to filter the items. Then click on an item on the left side to display details instead of all objects.
- Easy-to-view – no server required, reports work perfectly in the local environment. Click on the index.html file to view the report. It’s that simple.
- Easy-to-share – zip the report and send it to a colleague, or upload the report to your server and then embed the files on your favorite site using the IFRAME tag.
How to create a data model report in Moon Modeler - data modeling and reporting tool
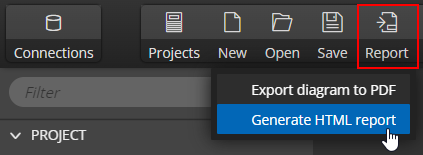
To craete a new report, open your project and click on the Report button on the main toolbar
Select the report style
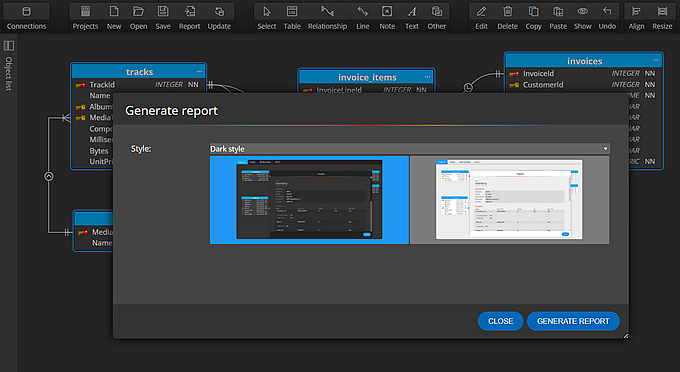
Select the target folder and generate the report.
How to add the generated report to other sites?
Use the iframe tag. Example of a report added to a page in the Atlassian Confluence
#